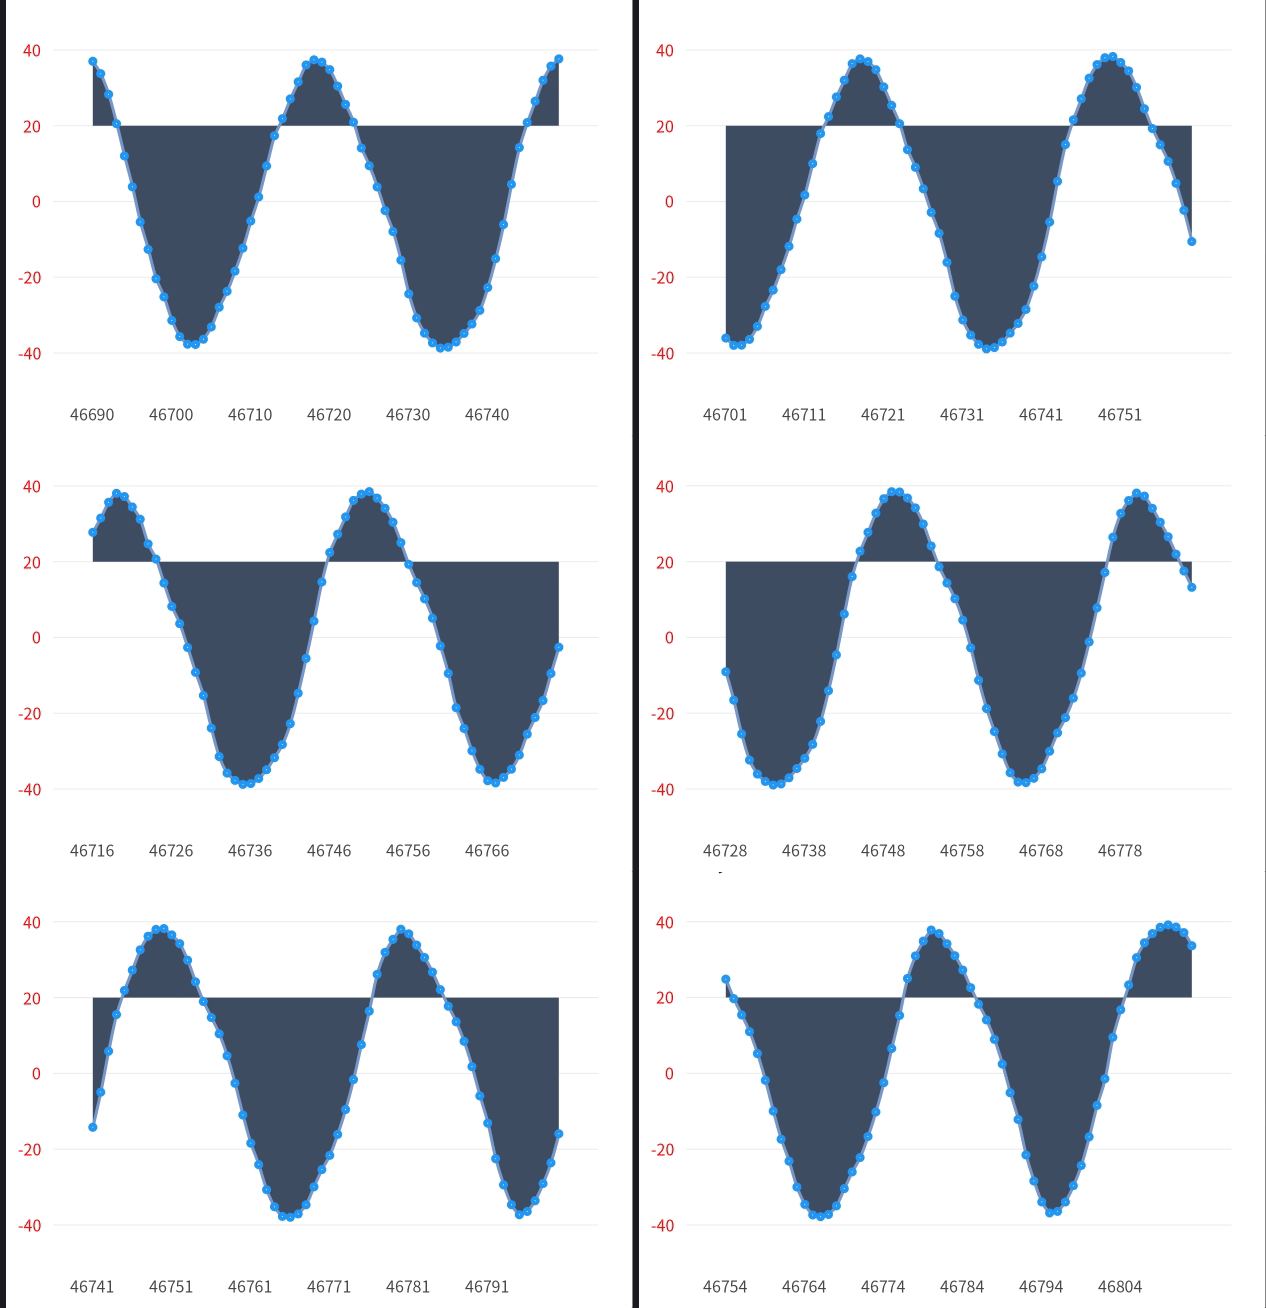
LiveCharts2 默认往 0 方向填充,如果要自定义填充方向,可以设置将实际数据设置一个偏移量,它所有数据移到合适的位置,然后再计算 Y 轴标签(因为是文字的, 可以随意调整)显示成正确的数值。
下面写了一个辅助类,将所有数据计算出偏移量后保存至数组中,再计算出对应真实值的标签,在下面使用两种方式设置到轴中
X轴,与待显示数据的数组同步计算出一个X轴坐标标签列表 (ReadOnlyObservableCollection<string>),设置到X轴对象的Labels属性中Y轴,使用Y轴的Labeler回调函数调用辅助类函数进行计算得到Y轴坐标标签- 所有数据值保存于
ObservableCollection中,并只保留最后几个值,这样会显示出动画滚动效果 - 下面的例子中使用了 Rx.net 监控
ObservableCollection的值变化,并选择属性生成另外一个ReadOnlyObservableCollection数组
辅助类
public class LiveChartsCollection
{
    private readonly double baseLine;
    private readonly int limit;

    // 所在要显示的点的列表
    private readonly ObservableCollection<Point> pointCollection = new();

    // 与 pointCollection 同步的 xLabel 的值列表
    private readonly ReadOnlyObservableCollection<string> xLabelCollection;

    // 与 pointCollection 同步的 yLabel 的值列表
    private readonly ReadOnlyObservableCollection<string> yLabelCollection;

    private int xAxisIndex = 0;

    // baseLine 基准线, 实际为被偏移为 0
    // limit 显示最后的 n 个点,
    public LiveChartsCollection(double baseLine = -65, int limit = 30)
    {
        this.baseLine = baseLine;
        this.limit = limit;

        // 使用 rx.net 为 pointCollection 生成 IObservable ,为下一步生成 xLabel 与 yLabel 列表
        var observableChangeSet = this.pointCollection.ToObservableChangeSet();

        // 分别取出 YLabel 与 XLabel 生成 2 个 ReadOnlyObservableCollection 数组
        observableChangeSet.Transform(it => it.YLabel).AsObservableList().Connect().Bind(out this.yLabelCollection).Subscribe();
        observableChangeSet.Transform(it => it.XLabel).AsObservableList().Connect().Bind(out this.xLabelCollection).Subscribe();

        this.ValueCollection = new ReadOnlyObservableCollection<Point>(this.pointCollection);
    }

    // 公开  yLabelCollection
    public ReadOnlyObservableCollection<string> YLabelCollection => this.yLabelCollection;

    // 公开  xLabelCollection
    public ReadOnlyObservableCollection<string> XLabelCollection => this.xLabelCollection;

    // 公开  pointCollection 坐标点
    public ReadOnlyObservableCollection<Point> ValueCollection { get; init; }

    // 添加值
    public void AddValues(params IEnumerable<double> values)
    {
        Dispatcher.UIThread.Post(() =>
        {
            // 根据偏移量计算出新的值,并计算出 x 与 y 坐标显示值
            // 这里放在 UIThread 中执行,实测中如果放在后台中插入数据,前台显示值时,可能会同时操作 pointCollection 导致报错
            foreach (var value in values)
            {
                var newValue = value - this.baseLine;
                var x = $"{this.xAxisIndex++}";
                var y = this.GetYAxis(newValue);
                this.pointCollection.Add(new Point { Value = newValue, XLabel = x, YLabel = y, OriginValue = value, });
            }

            if (this.limit <= 0)
            {
                return;
            }

            while (this.pointCollection.Count > this.limit)
            {
                this.pointCollection.RemoveAt(0);
            }
        });
    }

    // 获取 y 轴的坐标值
    public string GetYAxis(double value)
    {
        return $"{value + this.baseLine}";
    }

    public class Point
    {
        public double Value { get; set; }
        public string XLabel { get; set; }
        public string YLabel { get; set; }
        public double OriginValue { get; set; }
    }
}
前台显示
   <!-- xmlns:liveChartsCore="clr-namespace:LiveChartsCore.SkiaSharpView.Avalonia;assembly=LiveChartsCore.SkiaSharpView.Avalonia" -->
  <liveChartsCore:CartesianChart Series="{Binding Series}" XAxes="{Binding XAxes}" YAxes="{Binding YAxes}" />
后台代码
 var liveChartsCollection = new LiveChartsCollection(20, 60);

        this.Series = new[]
        {
            new LineSeries<LiveChartsCollection.Point>
            {
                // 需要显示在坐标中的值列表
                Values = liveChartsCollection.ValueCollection,
                // 坐标轴中标点的尺寸大小
                GeometrySize = 5,
                // 填充颜色
                Fill = new SolidColorPaint(new SKColor(63, 77, 99)),
                // 线条颜色
                Stroke = new SolidColorPaint(new SKColor(120, 152, 203)) { StrokeThickness = 3, },
                // 因为传入的是对象,这里要映射成坐标, index 为当前坐标中所在点的索引
                Mapping = (point, index) => new Coordinate(index, point.Value),
            },
        };

        this.YAxes.Add(new Axis
        {
            // 使用回调用获取 y 轴标签
            Labeler = (value) => liveChartsCollection.GetYAxis(value),
            // 自动更新的 y 轴标签,  在 x 轴上工作正常,但是 Y 轴上有问题,不清楚原因`
            // Labels = liveChartsCollection.YLabelCollection,
            IsVisible = true,
            // 轴标签颜色
            LabelsPaint = new SolidColorPaint(SKColors.Red),
            // 字体大小
            TextSize = 16,
        });

        this.XAxes.Add(new Axis
        {
            // 自动更新的 x 轴标签
            Labels = liveChartsCollection.XLabelCollection,
        });

        // 模拟插入一批数据
        liveChartsCollection.AddValues([-40, -30, -20, -10, -5, 0, 5, 10, 20, 30, 40, 50, 60,]);

        Task.Run(async () =>
        {
            await Task.Delay(TimeSpan.FromSeconds(5));

            // 模拟插入一个正统波数据
            var degrees = 0d;
            while (true)
            {
                await Task.Delay(TimeSpan.FromSeconds(0.1));

                var value = Math.Sin(degrees * Math.PI / 180.0) * 40;
                liveChartsCollection.AddValues(value);
                degrees += Random.Shared.Next(5, 20);
            }
        });